
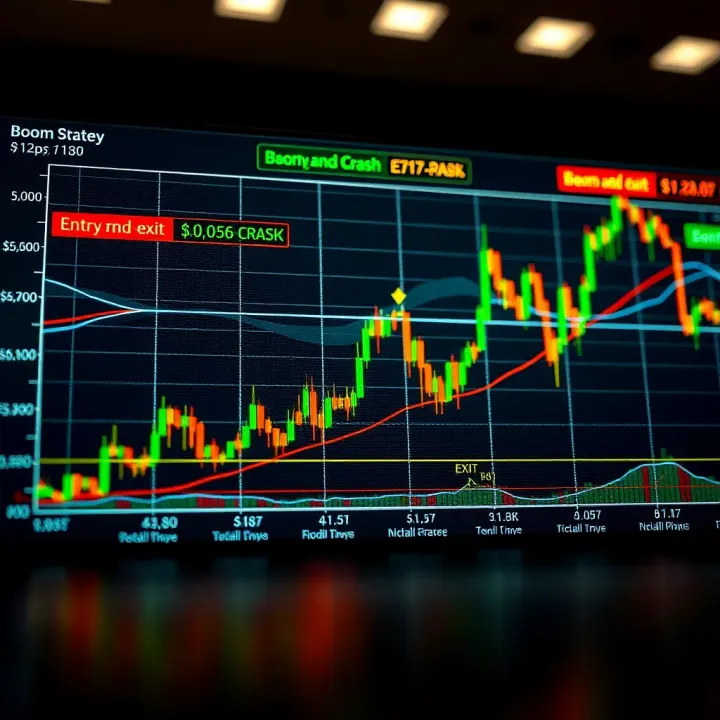
Boom and Crash Trading Strategy Explained
📈 Master the Boom and Crash trading strategy for indices with clear steps, risk tips, and tools suited for South African traders aiming to trade smarter and safer.
Edited By
Sophie Bennett
Boom and crash indices are unique trading instruments where price moves in sudden surges, or “spikes”, that can be exploited if you understand their behaviour. These spikes represent rapid shifts—either upwards in boom indices or downwards in crash indices—that often last only seconds but can offer significant profit opportunities.
Traders looking to benefit must first grasp what causes these spikes. Typically, spikes are triggered by bursts of market activity or liquidity imbalances, where buying or selling pressure outweighs the opposing side sharply. Understanding the timing and conditions around these spikes lets you position entries and exits more effectively.

Successful spike trading depends heavily on recognising early market signals and managing risk carefully—missing this can be costly.
Key indicators to watch include volume surges, candle patterns signalling exhaustion or reversal, and volatility shifts. For example, a sudden jump in trade volume coupled with a sharply elongated spike candle often suggests a strong move is underway but may soon correct.
Practically, traders employing spike strategies often use tight stop-loss orders and scale positions to protect capital when the market reverses quickly. A common tactic is entering trades immediately after a spike confirms direction, then taking profits fast as momentum fades. This approach suits the unpredictable nature of boom and crash indices where trends are short-lived.
Risk management is also critical. Setting realistic profit targets and not chasing every spike prevents severe drawdowns. Trailing stops can lock in gains as the price moves, but overexposure during high-volatility moments increases risk disproportionately.
This article will detail how to spot these spikes in real time, the best signals to trust, and step-by-step tactics for precise entries and exits. We’ll also cover common pitfalls, like false breakouts or overtrading, to help you refine your strategy and improve your overall trading outcomes.
Getting a solid grip on boom and crash market movements is key for any trader aiming to make consistent profits. These markets are known for sudden, sharp price jumps — or spikes — that can either offer quick wins or sting an unprepared trader. Knowing what drives these movements helps you separate genuine opportunities from false alarms.
Boom and crash indices are synthetic markets you’ll often find on CFD platforms like Deriv. They mimic sudden upward or downward price movements without representing a physical asset. The "boom" index typically features occasional big upward spikes against a generally falling trend, while the "crash" index flips this, showing sharp drops amid an overall rise. Because these indices don't rely on traditional supply and demand, they create unique trading conditions that traditional stock or forex traders might find unfamiliar.
Spikes in boom and crash indices arise mostly due to algorithm-driven orders that simulate quick bursts of activity. Underlying these bursts is a programmed interplay of buying and selling pressures designed to reflect sudden market shifts. Market volatility plays a big role, too—when overall market sentiment gets jittery, you’ll notice sharper, more frequent spikes. For instance, during times of global economic uncertainty, such as shifting interest rates by the South African Reserve Bank, these synthetic markets tend to react with more aggressive spikes.
Spikes often appear as sharp, elongated candlesticks piercing above or below recent price levels. Common patterns include sudden price surges followed by quick retracements, forming what traders call "wick" or "tail" spikes. Sometimes, these spikes occur in clusters, resembling a rapid-fire series of moves, which can mislead traders into thinking a new trend has begun. Recognising these typical spike shapes helps you time entries better—enter too early during a false spike cluster, and you’re likely to get stopped out unfairly.
Not every sharp move is worth trading. Often, price noise—random, short-lived movements—can be mistaken for a spike. Genuine spikes usually come with accompanying volume surges or clear momentum shifts visible through technical indicators like the Relative Strength Index (RSI) or Moving Average Convergence Divergence (MACD). For example, a spike supported by increased volume and a breaking of key resistance is more trustworthy than a solitary price jump on low volume.
The trick is learning to read your charts to spot when a spike carries real momentum versus when it’s just a market hiccup. This’ll save you from chasing shadows and blowing your trading budget.
Understanding these dynamics provides a solid foundation to craft strategies that play smart, not hard, in the boom and crash arena. It’s about blending observation with discipline to catch the right moves when they happen.
A solid spike strategy in Boom and Crash trading centers on recognising specific signals and understanding market behaviour during sudden price shifts. These core components guide traders to act decisively when spikes appear and avoid common pitfalls that stem from misreading the market.
Volume often acts as the backbone to price movements, especially with spikes. When a sudden surge in volume accompanies rapid price changes in the Boom or Crash indices, it signals strong market interest—either buying or selling pressure. For instance, a spike accompanied by increased volume confirms the strength behind the move, helping traders avoid traps set by low-volume blips.
Price action, or the way prices move on a chart, reveals patterns that highlight spikes. Sharp upward or downward moves, followed by quick reversals, showcase typical spike behaviour. Analysing price action alongside volume allows traders to confirm if a spike is genuine or just market noise.
Specific candlestick patterns often hint at spike formations. Look out for large-bodied candles with long wicks, which indicate rejection zones where prices surge but then retreat. A bullish engulfing candle at support or a bearish shooting star near resistance often precedes strong spikes.
These formations provide visual cues on traders’ sentiment shifts, signalling potential entry or exit points. Combining these candle patterns with volume and price action increases the likelihood of spotting real spikes early.

Certain indicators excel with spike detection, such as the Average True Range (ATR) and Bollinger Bands. ATR tracks volatility – sudden jumps warn traders of upcoming spikes. Bollinger Bands show price volatility extremes; a breakout beyond the bands often aligns with spike events.
Similarly, oscillators like RSI (Relative Strength Index) can flag overbought or oversold conditions just before a spike reversal. Using these indicators in tandem aids in timing entries and exits more precisely.
Spikes tend to manifest more consistently during high liquidity periods when more traders interact. For Boom and Crash indices, this often involves overlapping market sessions, such as the London and New York overlap or key economic news release times.
For example, trading spikes around 9 am to 11 am SAST when international equity markets open can offer higher volatility and clearer spike setups. Avoid trading during quiet local hours to reduce the risk of false spikes due to low volume.
Market conditions heavily influence spike reliability. Periods of consolidation or low volatility can precede big spikes, as pressure builds. Conversely, during unpredictable events—like unexpected political announcements or Eskom-related news—spikes may behave erratically.
Traders should watch out for wider market trends on major indices, as Boom and Crash spikes often reflect broader sentiment shifts. Combining spike signals with overall market direction improves decision-making and reduces whipsaws.
Mastering the right tools and timing is more than just watching a chart—it’s about reading market mood and context, sharpening your edge when spikes roar into view.
Breaking down your trading approach into clear steps is essential when dealing with the rapid and often unpredictable swings of boom and crash indices. A structured approach helps traders avoid knee-jerk reactions during spikes and builds discipline, which is crucial for consistent success. This section guides you through setting up your charts, timing entries, recognising valid signals, and cutting losses or locking in profits, all tailored to the unique environment of these volatile markets.
Setting up your charts appropriately is your first critical move. Use clean, uncluttered layouts with price candles and volume indicators visible. Boom and crash markets can be noisy, so avoid bombarding your screen with too many indicators — instead, rely on those which directly highlight spikes, such as volume spikes combined with candlestick patterns. For example, a sudden surge in volume paired with a long wick candle may signal the start of a real spike.
Customising colours for easy visual recognition also helps. For instance, setting bullish candles in a bright green and bearish in red makes it easy to spot significant moves without straining your eyes during fast-paced moments.
Selecting the right timeframe impacts how you interpret spikes. Typically, lower timeframes like 1-minute or 5-minute charts capture spikes sharply, revealing entry and exit points more clearly. However, pairing these with higher timeframes such as 15-minute can help filter out the noise and confirm whether a spike is part of a bigger trend or just a short-lived jump.
In practice, a trader might watch a 5-minute chart to spot a spike forming and then glance at a 15-minute to see if volume and price action align, helping avoid false alarms that can come from erratic low-timeframe moves.
Focus on signals that reliably indicate the start of a spike. Key among these are bullish or bearish engulfing patterns combined with volume surges and momentum indicators like the Relative Strength Index (RSI) crossing specific levels. For example, an RSI jumping above 70 together with a strong bullish engulfing candle on boom indices suggests strong upward momentum worth entering.
Also, watch for price breaking above recent resistance or below support with conviction. Volume acting as a confirming factor here can make a big difference, warning you against jumping into traps.
Not every burst of price movement is genuine; false breakouts can wipe out your capital fast. Confirmations come from multiple factors aligning — for instance, a spike accompanied by rising volume, a clear chart pattern, and support from technical indicators.
One practical tip is to wait for a candle close beyond a key level rather than entering at the initial move. This patience helps you avoid chasing volatile price jumps that quickly retrace. Setting alerts on important price points can help you act without staring at charts all day.
Knowing when to take profits during spikes is just as important as timing your entries. Many traders use trailing stops that move with the price during a spike, locking in gains as the trade progresses. For example, if you bought into a crash spike rally, you could trail your stop-loss just below each new swing low to protect profits.
Fixed target exits based on measured moves or recent highs and lows are also effective. Using Fibonacci retracement levels or previous swing points provides concrete target zones, reducing guesswork.
Stop-losses protect against losing streaks common in fast-moving boom and crash indices. Place your stop-loss beyond areas of support or resistance rather than arbitrarily tight to avoid stop-outs caused by normal price jitter.
Adjust stops as the trade moves in your favour — moving stops up to breakeven or better avoids turning winning trades into losses. Consider market volatility too; when spikes occur, wide stops might be necessary to prevent premature exits. Balancing risk and reward here keeps your capital safe for the next opportunities.
A disciplined, step-by-step method builds confidence and reduces emotional trading, essential when spikes can whip prices sharply in moments. With the right setup, entry signals, and exit plans all in place, you stand a better chance to capitalise on boom and crash spikes profitably.
Trading boom and crash spikes presents unique risks due to their sudden and volatile nature. Managing these risks is critical to protect your capital and maintain consistent performance. Unlike slower-moving markets, boom and crash indices can whip sharply without much warning. Therefore, a clear risk strategy isn’t just practical—it’s essential.
Stop-loss and take-profit points are your safety nets when the market turns on a dime. Setting a stop-loss means you limit your losses at a pre-determined price, preventing a spike from wiping out a large chunk of your capital. For example, if you enter a long trade on a boom spike, placing a stop-loss just below the recent low safeguards against sudden reversals.
Take-profit levels help lock in gains before a spike fades. It’s tempting to hold out for bigger profits during volatile runs, but boom markets often reverse quickly. Using a trailing stop-loss can also be effective—this moves your stop level up as the price climbs, securing profits while allowing the trade room to breathe.
Proper stop-loss and take-profit settings stop emotion from dominating your decisions and provide a disciplined trading framework.
Volatility is the heart and soul of boom and crash trading, but it can also turn against you fast. Be prepared for sudden price swings by avoiding trailing stop placements that are too tight; they’ll trigger prematurely in choppy conditions. Conversely, the stops shouldn’t be so wide that you risk large losses.
Unexpected market moves—like sudden spikes during low liquidity hours or just after major economic news—can cause slippage or requotes on your broker platform. To counter this, trade during more liquid times such as the European and US sessions overlap and monitor local news affecting global markets. Avoid trading during known high-impact events unless you have specific strategies.
Correct position sizing is fundamental in managing risk. Because boom and crash spikes can rapidly eat into your funds, size your positions so losses stay within a manageable range—generally no more than 1-2% of your trading capital per trade.
For instance, if you have R50,000 in your trading account, risking R500 to R1,000 per trade keeps you afloat even if a few trades go against you consecutively. Many traders neglect this and end up blowing accounts chasing recovery after big losses.
Additionally, avoid increasing your position size impulsively after wins or losses; keep your trade sizes consistent to preserve long-term capital. Diversifying trade entries and not putting all funds into one spike opportunity also helps mitigate risk.
In summary, managing risk in boom and crash spikes is about setting realistic stop and target levels, understanding when and how volatility impacts trades, and sizing your position wisely. This combination keeps your trading sustainable through the rollercoaster moves these indices are famous for.
When trading Boom and Crash spikes, recognising common pitfalls can save you a lot of frustration and losses. These markets are fast-moving and volatile, so even experienced traders can slip up without a solid plan to avoid typical errors. This section highlights three major mistakes and how you can steer clear of them to improve your trading outcomes.
Overtrading happens when traders get caught up in the excitement of rapid price moves and open too many positions or trade excessively. It often stems from a fear of missing out, especially during volatile spike events where prices can jump quickly. This behaviour can drain your capital fast due to higher transaction costs and increased exposure to risk.
To avoid overtrading, focus on quality over quantity. Stick to your pre-set trading plan and only take trades that meet your strict entry criteria. For instance, if your strategy calls for a confirmed spike with supporting volume, don't jump in just because the price surges without confirmation. Keeping a clear head and pacing your trades will help you avoid rash decisions and keep your exposure manageable.
Ignoring or misreading essential indicators can derail your spike strategy. Boom and Crash indices respond heavily to specific signals like volume surges, candlestick patterns or momentum indicators. Disregarding these means you might enter false breakouts or miss prime opportunities. For example, trading a spike without verifying volume increases or ignoring bearish engulfing candlesticks could lead to entering just as the move exhausts.
Keep a checklist of your critical indicators and follow them religiously. Suppose your system flags a spike only when the RSI exceeds a certain threshold or the relative volume spikes; resist the temptation to trade without these confirmations. This discipline lets you filter noise from genuine moves, increasing the odds of success.
Perhaps the most costly mistake is weak risk control. Without appropriate stop-loss levels, position sizing, and realistic profit targets, even well-timed trades can wipe out gains or capital swiftly. For instance, placing stop losses too tight during volatile spikes invites premature exits, while too loose stops can mean painful drawdowns. Similarly, risking too much capital on a single trade is a recipe for disaster.
Adopt clear rules: never risk more than 1–2% of your capital on any trade, set stop losses where the spike invalidates your trade idea, and define clear exit points to lock in profits. Remember, preserving your trading capital is key to staying in the game long term.
Proper risk management transforms trading from gambling to calculated investing.
By avoiding these common mistakes—overtrading, disregarding key signals, and poor risk practices—you create a sturdy foundation for navigating Boom and Crash spikes with more confidence and consistency. This careful approach reduces emotional trading, protects your funds, and increases your chances of profiting from sharp market moves.
📈 Master the Boom and Crash trading strategy for indices with clear steps, risk tips, and tools suited for South African traders aiming to trade smarter and safer.

📈 Learn trading basics, strategies, and risk management in our practical guide series. Ideal for anyone ready to trade confidently in South African markets.

🤖 Learn how free trading bots work, their benefits and risks, plus practical tips for South African traders to automate trades safely and effectively with no upfront cost.

📊 Understand surge trading with strategies, risk management, tools, beginner tips & regulations to trade sudden market moves confidently in South Africa.
Based on 9 reviews