

Trading Guide for Beginners: Start Smart
📈 Learn trading basics, strategies, and risk management in our practical guide series. Ideal for anyone ready to trade confidently in South African markets.
Edited By
James Whitmore
Trading indices like Boom and Crash has gained traction among many traders here and abroad due to their unique movement patterns and volatility. The Boom and Crash indices provide a playground where sudden price surges (booms) and sharp drops (crashes) dominate, creating both challenges and opportunities for traders.
Understanding these indices' behaviour is fundamental to forming a strategy that fits your risk tolerance and trading style. The Boom index, for instance, is characterised by frequent sharp spikes, while the Crash index tends to show sudden plunges. Recognising these tendencies can help you anticipate price action rather than just react to it.
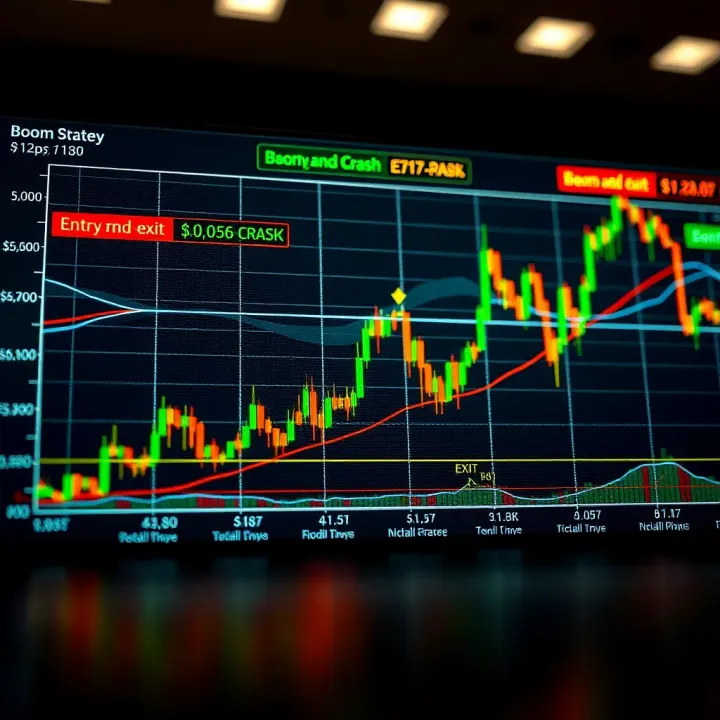
A well-crafted Boom and Crash trading strategy relies on more than just spotting trends. It involves identifying entry and exit points that match the rhythm of these erratic movements, often using technical tools like moving averages, Relative Strength Index (RSI), or even simple price action signals.
Successful trading here demands patience and discipline – rushing in after a boom or crash can easily wipe out gains.
Key aspects to keep in mind include:
Timing: Waiting for clear confirmation of price direction before entering a trade.
Risk Management: Employing stop-loss orders to cap losses, especially crucial in these volatile indices.
Adaptability: Adjusting position sizes and strategies according to market conditions and your own performance.
For South African traders, it’s worth noting that factors such as data cost, platform choice, and local regulation (including the Financial Sector Conduct Authority rules) also play a role in how effectively you can trade these indices.
This section aims to set the foundation by clarifying what Boom and Crash indices are, why their trading requires a tailored approach, and which broad principles guide successful strategy development. From here, we will break down practical techniques and common pitfalls to avoid, ensuring you're equipped to take on these dynamic markets wisely.
Understanding Boom and Crash indices is crucial for traders aiming to navigate markets with unique volatility and distinct price behaviours. These indices offer fresh opportunities compared to more traditional markets like the JSE or global blue-chip stock indices. Grasping what sets them apart helps traders develop strategies that fit these dynamic environments, enhancing potential profits and managing risks effectively.
Boom and Crash markets are synthetic indices offered mainly on CFDs (contracts for difference) platforms. The Boom index experiences sudden, sharp price jumps that create distinct upward spikes, while the Crash index exhibits steep drops, with sudden downward spikes. These price movements are driven by algorithmic factors rather than fundamental asset performance. For instance, during a Crash spike, prices may plunge rapidly within seconds before stabilising, requiring traders to be swift and precise in their reactions.
These sudden movements reflect a unique market behaviour that differs from most equity or commodity indices, where price changes usually unfold more gradually. Traders benefit because these spikes expose short-term, high-volatility trading windows leading to rapid gains if timed correctly.
Unlike traditional indices like the FTSE/JSE Top 40 or S&P 500, Boom and Crash indices don't represent baskets of actual stocks. Instead, they simulate price behaviour influenced by programmed algorithms designed to mimic volatile market actions. This means they are less sensitive to global economic news or company earnings but heavily influenced by built-in market mechanics.
For example, while a JSE Top 40 index might react slowly to political developments or interest rate announcements, Boom and Crash prices shift sharply on shorter notice without those external signals. This presents both an opportunity and a challenge, as trading these indices relies more on technical reading and timing than fundamental analysis.
The high volatility seen in Boom and Crash indices creates multiple chances to profit from quick price moves. Daily price spikes often occur at irregular intervals, offering frequent entry and exit points. In South Africa, where data costs and trading hours matter, these indices allow traders to engage in short bursts rather than long trades requiring prolonged exposure or expensive data packages.
Take the Boom index: a trader might spot a sudden upward spike forming and execute a sell trade immediately after the spike peaks, capturing profits within seconds. Conversely, the Crash index can be used to short-sell during abrupt price falls. This sort of rapid trading appeals to those who prefer active, hands-on market involvement rather than a buy-and-hold style.
Boom and Crash indices provide an accessible entry point for both novices and experienced traders in South Africa. Beginners can start with smaller trade sizes to test the waters without the complexity of analysing company fundamentals. Seasoned traders might exploit advanced indicators or refined entry-exit strategies to capitalise on the characteristic spikes.
Because these markets don't rely heavily on external news, they can suit traders preferring disciplined technical setups. For example, a trader focused on swing trading or scalping might find these indices align well with their preferred timeframe. That said, patience is key, as mistiming trades during spikes can quickly lead to losses.
Trading Boom and Crash indices requires a different mindset — a blend of quick decision-making, well-honed technical skills, and disciplined risk management. Understanding the landscape is the first step to navigating it confidently.
This introduction sets the stage to delve deeper into core strategies, risk measures, and practical trading tips tailored to Boom and Crash indices.

Grasping the core principles behind Boom and Crash trading is essential for anyone serious about this market. These principles help traders understand the unique behaviour of these indices and guide decision-making to improve trade success. For instance, recognising patterns in price movements and knowing when to enter or exit trades can protect your capital and boost returns.
The price movements in Boom and Crash indices are marked by sudden, sharp spikes—these are the "boom" or "crash" moments. In Boom markets, you’ll spot rapid upward price surges, while Crash markets display swift sharp drops. These spikes occur because the market overshoots before quickly pulling back, creating distinct entry or exit opportunities. For example, if you observe a sudden upward spike followed by consolidation, it might signal a short-term selling chance.
Traders often look for common technical setups to identify these patterns. Chart formations like the classic double top or double bottom, as well as candlestick signals such as pin bars or engulfing patterns, can hint at potential boom or crash events. Pairing these with volume analysis or oscillators like RSI can provide added confirmation. For example, spotting a double bottom near oversold RSI levels may suggest the market is about to boom upwards.
Understanding the market phase is key to timing your trades effectively. The Boom and Crash indices generally move through phases of accumulation (consolidation), impulse (spikes), and correction. Recognising when the market is consolidating lets you prepare for possible explosive moves. If the market appears range-bound, aggressive entries might be risky, but during the impulse phase, well-timed trades can be more rewarding.
Entry triggers often come from breakout signals, such as price breaking above a resistance level after consolidation or a well-formed pattern completing. Conversely, exit signals should protect your profits or limit losses, like setting stop losses below recent lows in Boom markets or above highs in Crash markets. Using trailing stops after a winning trade starts can help secure gains while allowing the market room to breathe.
Successful Boom and Crash trading hinges on spotting precise patterns and nailing the timing for entries and exits, balancing between patience and decisiveness.
Mastering these core principles keeps you grounded amid the market’s volatility and helps tailor your strategy to real-time conditions, especially when trading from South Africa where volatility can vary due to global and local factors.
Practical techniques form the backbone of successful Boom and Crash trading. This section focuses on the real-world application of strategies aimed at navigating these volatile indices effectively. Understanding which tools to use and how to manage risks through position size and leverage can make a significant difference between consistently profitable trading and avoidable losses.
Technical indicators are essential for Boom and Crash trading, where price swings can be sudden and sharp. Indicators like the Relative Strength Index (RSI), Moving Average Convergence Divergence (MACD), and Bollinger Bands provide insight into momentum, trend strength, and volatility. For example, the RSI helps identify overbought or oversold conditions, signalling possible reversals, while Bollinger Bands highlight periods of low volatility that often precede big market moves.
Interpreting these signals effectively requires context. An RSI below 30 may suggest a buying opportunity in a crash market, but this should coincide with confirmation from price action or another indicator like MACD crossings. Traders need to watch for divergences where the price makes a new high or low, but the indicator does not, as this can signal a shift in momentum. Using multiple indicators in harmony improves chances of identifying reliable entry and exit points while filtering out noise.
Position sizing ensures that a trader's exposure aligns with their risk tolerance and account size. A common approach is to risk no more than 1–2% of the total trading capital on any single trade. For instance, with R10,000 in your account, limit risk to R100–R200 per trade. This cautious sizing helps weather losing streaks without depleting the account.
Leverage amplifies both gains and losses, so it demands careful handling, especially under South African regulations, which cap maximum leverage on retail forex and CFD trades to protect traders. The Financial Sector Conduct Authority (FSCA) sets these limits to prevent excessive risk-taking. Traders should select brokers compliant with these rules and consider lower leverage ratios initially to understand the market dynamics before scaling up. Remember, just because you can use high leverage doesn’t mean you should—smart leverage use helps preserve capital over the long run.
Maintaining practical discipline with indicators and trade sizing is what separates consistent Boom and Crash traders from those who fall victim to the market's unpredictability.
By integrating these technical tools and sensible risk practices, traders can turn Boom and Crash’s characteristic volatility into well-timed opportunities rather than reckless gambles.
Risk management is essential when trading Boom and Crash indices. These markets show sudden spikes and steep movements that can wipe out gains quickly if you're not prepared. Managing risk helps preserve capital, so you remain in the game longer rather than losing your shirt on one bad trade. In the context of Boom and Crash trading, specific tools like stop losses and take profits become indispensable to control how much you can lose or gain on each trade.
Using stop losses effectively means setting a limit on how much of your trading capital you’re willing to lose on a single trade. For Boom and Crash indices, where price spikes happen suddenly, stop losses protect you from unexpected, sharp drops. For instance, if you are trading the Crash 100 index and expect a drop, placing a stop loss just beyond a recent high prevents you from holding through a reversal that turns against you.
Take profits work hand in hand with stop losses. Setting realistic profit targets helps you bank gains before the market retraces. If you aim for overly ambitious profits on Boom and Crash trades, you might miss the chance to exit profitably when the price spikes back or stalls. Keep your take profits aligned with the usual movement size on these indices — not too tight to get stopped out prematurely, but not so loose that the market rarely hits them.
Avoiding impulsive decisions is arguably one of the toughest parts of Boom and Crash trading. Those sudden spikes can lure traders into chasing the market or closing positions prematurely out of fear. Managing your emotions means recognising that price swings are part and parcel of these indices. If you jump in or out without a plan, you risk making costly mistakes.
Building a solid trading plan and sticking to it anchors your actions. This means defining your entry and exit rules, risk limits, and position sizes before placing a trade. For example, you might decide never to risk more than 2% of your trading capital on any one Boom or Crash trade. When emotions run high, referring back to your plan keeps you on track and prevents knee-jerk reactions. Discipline gives you staying power in volatile markets, increasing the chance of consistent returns over time.
Successful Boom and Crash traders don't just react to price changes—they manage risk actively and control their emotions to trade smarter, not harder.
Effective risk management and disciplined behaviour cut through the noise of Boom and Crash trading, turning wild market swings into workable opportunities.
Trading Boom and Crash indices comes with its own set of hurdles that can catch even experienced traders off guard. Identifying these common challenges and learning how to adjust is essential for maintaining consistent results and safeguarding your capital. South African traders, in particular, need to stay alert to the dynamic nature of these markets, where sudden jumps can tempt poor decision-making. Below, we break down some frequent mistakes and offer practical ways to shape your strategy to current market conditions.
One common trap traders fall into is chasing after every spike in Boom and Crash indices. These markets are known for their sharp, sudden movements, which can trigger a rush to enter trades repeatedly without careful analysis. For instance, after a crash spike where prices suddenly drop, some traders might impulsively enter multiple positions, hoping to catch a quick rebound. This behaviour often backfires when the market remains volatile, resulting in rapid losses.
It's crucial to maintain discipline and trade only when your setup and timing criteria align. Overtrading eats into your trading capital with unnecessary spreads and commissions, and increases emotional strain. Taking a step back to assess whether the current market phase supports your strategy can prevent this costly mistake.
While technical analysis dominates Boom and Crash trading, ignoring broader market fundamentals can lead to bad timing and unexpected reversals. Economic news, changes in interest rates by the South African Reserve Bank (SARB), or shifts in global sentiment can influence market volatility and trend direction. For example, a major announcement on inflation figures or SARB's repo rate might cause extended volatility, making usual patterns less reliable.
Being aware of such events helps you avoid entering trades just before a spike caused by external forces. Incorporate a basic economic calendar into your routine to pause trading during potentially disruptive announcements. This approach strengthens risk management and improves your trade selection.
Boom and Crash indices do not behave the same way every day. Periods of high volatility can create more spikes and rapid price swings, while quieter phases see less dramatic moves. Your strategy must be flexible enough to adapt.
If volatility increases, it might be wise to tighten your stop losses and reduce position sizes to protect capital. Conversely, during calmer markets, you may allow for wider stops and seek different entry points. Keeping an eye on the Average True Range (ATR) indicator or similar tools offers concrete clues about current volatility levels.
The Boom and Crash markets shift between trending behaviours and phases where prices chop sideways within a range. In range-bound markets, breakout attempts often fail, and false spikes occur more frequently. Here, employing a range-trading strategy—buying near support and selling near resistance—can yield better results.
In trending markets, however, breakouts tend to follow through. It's beneficial to trade with the trend, using momentum-based entries, and allowing profits to run longer. Indicators like moving averages help define trend direction.
Tailoring your approach according to whether the market is trending or stuck in a range improves your odds. Recognising these conditions early can save you from unnecessary losses and missed opportunities.
By recognising these challenges and adjusting your methods accordingly, you build resilience in your Boom and Crash trading. This proactive mindset is key to avoiding avoidable errors and staying ahead in the demanding world of index trading.
Trading Boom and Crash indices requires more than just knowledge of patterns and risk management; it hinges on having the right tools and support at your disposal. With volatile price swings and rapid market movements, traders benefit greatly from reliable platforms, quality software, and ongoing access to educational material and community insights. These resources can sharpen decision-making, improve execution speed, and help maintain discipline amid market noise.
Popular platforms offering Boom and Crash indices
Several brokers and trading platforms have made Boom and Crash indices available to South African traders, adding an alternative to more traditional equity or forex options. Platforms like Deriv and IG provide direct access to these indices, offering various leverage options suited for different risk appetites. Using a well-regulated platform with access to Boom and Crash helps traders make the most of the distinctive volatility these indices present.
Essential platform features
A trading platform must include quick order execution to capture short-lived price spikes common in Boom and Crash markets. Features like one-click trading, multiple chart views, and real-time price alerts are invaluable. Additionally, access to technical indicators integrated within the platform supports sound analysis. For example, MT4 or MT5 integration is helpful where available, as South African traders often use these for their simplicity and robust libraries of expert advisors and custom indicators.
Where to learn more about Boom and Crash
Solid education underpins any successful trading strategy. South African traders can access a variety of online tutorials, webinars, and courses specifically on Boom and Crash indices through platforms like Takealot Learning or local trading academies. Many brokers also provide free resources tailored to Boom and Crash, covering everything from basic concepts to advanced setup optimisation, which help traders build knowledge at their own pace.
Engaging with local and global trading communities
Joining a community of traders can offer practical insights beyond what textbooks provide. South African traders can join local Facebook groups or WhatsApp forums centred on trading these indices, sharing real-time experiences and tips. Moreover, global forums like those on MyBroadband or TradingView encourage broader discussion and expose traders to diverse perspectives and strategies. Community interaction fosters accountability and can help curb emotional trading, which is a common pitfall in volatile markets.
Pairing the right tools with ongoing support and education makes the difference between swinging aimlessly and trading with purpose in Boom and Crash markets.
📈 Learn trading basics, strategies, and risk management in our practical guide series. Ideal for anyone ready to trade confidently in South African markets.

Explore synthetics trading 📊: key concepts, types, tech, risks & tips tailored for South African investors aiming to navigate modern financial markets confidently.

📘 Explore simple trading book patterns with practical tips to boost your trades. Perfect for beginners eager to make smarter market moves in South Africa!

🤖 Discover how forex trading robots work, their pros and cons, setup tips, and how to manage risks for smarter trading decisions in South Africa's forex market.
Based on 7 reviews