

Understanding Chart Patterns: A Practical Guide
📈 Learn to spot key chart patterns in trading with this practical guide. Understand price moves, interpret formations, and access helpful PDF resources to improve your skills.
Edited By
Benjamin Harper
Forex chart patterns act like signposts for traders trying to read the market’s next moves. By identifying these shapes and formations on price charts, you can catch hints about where the market might head next – whether it’s gearing up to climb or about to take a dip.
Understanding chart patterns isn’t just for those with years of experience. Even beginner traders can spot these formations and use them as a tool in their decision-making toolkit. For instance, common patterns such as 'head and shoulders' or 'double tops' can signal an upcoming reversal in price trends, while 'flags' and 'triangles' often suggest a continuation.

South African traders, in particular, face unique market conditions influenced by Eskom’s load shedding, fluctuating rand strength, and local economic shifts. Chart patterns help by filtering out some of this noise, offering clearer signals amid volatility. Plus, having downloadable PDFs with visual guides makes it easier to learn pattern recognition on the go – ideal when you’re trading from a busy Johannesburg office or your home in Cape Town.
Recognising forex chart patterns helps traders make sense of price action, improving their chances of entering and exiting trades at smart points.
Here are a few reasons why chart patterns matter:
Anticipate price movements: Patterns can hint at trend reversals or continuations.
Risk management: Knowing likely turning points can guide stop-loss placement.
Timing trades: Aligning entries with patterns improves trading efficiency.
This article breaks down essential forex chart patterns, showing you how to identify them practically with clear examples. The included PDFs offer quick reference tools you can print or keep on your device.
Whether you’re trading rand-based pairs like USD/ZAR or global majors, learning to read these visual cues will sharpen your approach and help navigate the often unpredictable forex market.
Forex chart patterns offer a visual shortcut to understand price behaviour in the market. Instead of guessing, traders use these shapes on charts to get a feel of where the market might head next. For anyone keen on trading forex, recognising these patterns can improve decision-making and reduce unnecessary risks.
Knowing chart patterns isn't just about spotting pretty shapes; it's about reading the market’s silent language. In South Africa, where economic shifts and global influences both play a role, spotting these patterns helps traders adapt and respond more confidently. For example, during times of local political uncertainty, certain reversal patterns might signal a shift in currency direction before the news reaches broader impact.
Forex chart patterns are distinctive formations that appear on price charts, reflecting the battle between buyers and sellers. Traders who use technical analysis rely on these patterns to anticipate probable price movements rather than relying solely on fundamentals. Practical relevance comes from their widespread acceptance and ability to provide visual cues, such as the Head and Shoulders or Double Bottom patterns, which hint at trend changes or continuation.
For instance, a Double Top pattern in the USD/ZAR pair might indicate that the price has reached a resistance level twice and is primed to drop, helping traders decide at what point to sell or short the rand.
Chart patterns mirror the emotions and actions of market participants—fear, greed, hesitation, and optimism. When a Triangle forms, it often suggests uncertainty, with neither bulls nor bears in full control. As the pattern reaches its apex, one group typically gains dominance, prompting a breakout.
Understanding this psychological backdrop sharpens a trader’s sense of timing. For example, during a period of high volatility caused by a Reserve Bank interest rate announcement, traders’ reactions are often captured in these patterns before price moves decisively.
Identifying chart patterns is like spotting signposts on the road ahead. While not foolproof, these signals help predict whether prices will rise, fall, or consolidate. This foresight assists traders in aligning their strategies with market trends instead of working against them.
For example, spotting an Ascending Triangle pattern in the EUR/ZAR might suggest a likely upward breakout, prompting traders to position themselves accordingly before the move happens.
Beyond predicting direction, chart patterns refine when to enter or exit trades. Knowing the moment when a Flag pattern completes helps a trader avoid jumping in too early or missing the ideal exit point.
Consider a trader watching the GBP/ZAR pair. If a Head and Shoulders pattern forms and completes, the trader can set a stop-loss above the right shoulder and enter a short position with more confidence. This disciplined timing can protect capital and enhance profits.
Recognising forex chart patterns equips you with a clearer map of market behaviour, helping you navigate trading decisions with greater confidence and control.
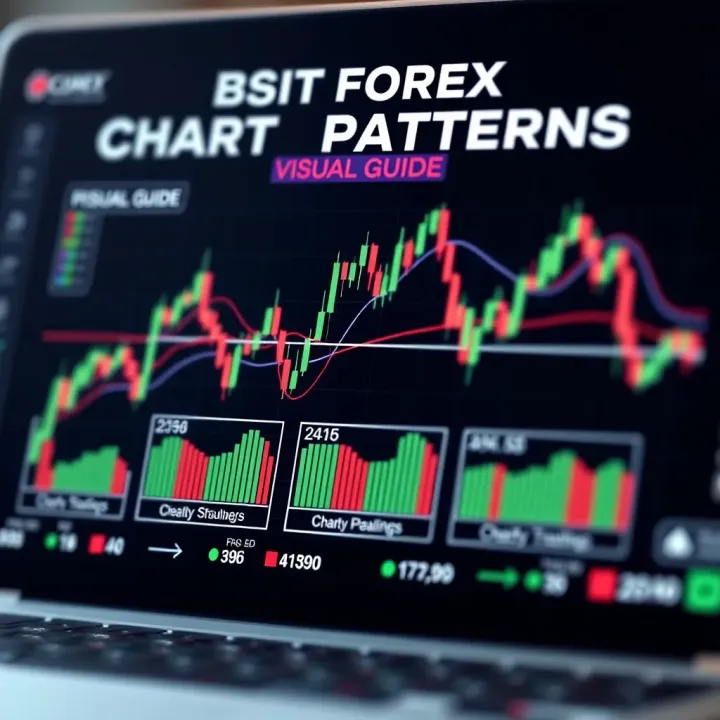
Understanding common forex chart patterns equips traders with visual clues about potential market moves. These patterns provide insight into price psychology, helping you anticipate whether trends will continue or reverse. Recognising these setups can improve timing for both entries and exits, which is vital for managing risk and maximising profits in the fast-moving forex market.
The Head and Shoulders pattern signals a likely reversal of an existing trend. It shows three peaks: a higher middle peak (head) flanked by two lower peaks (shoulders). Once the price breaks below the neckline formed by connecting the troughs, it usually points to a shift from bullish to bearish sentiment. For instance, if the ZAR/USD pair exhibits this pattern after a sustained rally, traders might expect the uptrend to falter and prepare to sell or tighten stop losses.
Conversely, the inverse Head and Shoulders suggests a bearish trend is losing steam and a reversal upwards is probable. This pattern is practical for spotting turning points and is widely used given its reliability when combined with volume confirmation.
Double Tops and Bottoms appear when price tests a support or resistance level twice but fails to break through. A Double Top marks a potential bearish reversal after an uptrend; price peaks twice at about the same level before falling. On the other hand, a Double Bottom signals a bullish reversal after a downtrend; price dips twice near the same level and then rises.
For example, the EUR/ZAR might form a Double Top near a strong resistance level after testing it twice within a short period. This alerts traders to potential selling opportunities or to prepare for downward pressure.
Triangles indicate temporary pauses in the market before the prevailing trend resumes. An Ascending Triangle forms when horizontal resistance meets rising support, often signalling a bullish breakout. The Descending Triangle has flat support and falling resistance, suggesting a bearish breakout. Symmetrical Triangles feature converging trend lines without a clear bias and may break in either direction.
These patterns are handy in forex to catch continuation moves, such as the GBP/ZAR pair consolidating within a Symmetrical Triangle before breaking decisively upwards on strong volume.
Flags and Pennants are short-term continuation patterns. Flags look like small rectangles slanting against the trend, while Pennants have converging trend lines forming a small symmetric triangle. Both form after strong price moves and usually precede a breakout in the same direction.
For instance, following a sharp rise in USD/ZAR, a Flag formation might emerge as the price pauses, giving traders a chance to add to positions ahead of the next jump. These patterns are practical for trading momentum and capturing swift movements with tight risk controls.
Mastering these common forex chart patterns can sharpen your market reads — making it easier to spot when a trend is about to turn or keep rolling. Patience and practice, coupled with confirmation tools, make these patterns far more dependable in real-world trading.
Chart pattern PDFs can be a real asset for forex traders who want to keep key information close without constantly switching screens or searching online. These guides condense complex concepts into clear visuals and notes, making it easier to spot patterns quickly when you're analysing charts, especially on the move or during fast market conditions.
Easy reference on the go
One of the biggest benefits of chart pattern PDFs is their portability. Traders often find themselves needing a quick refresher on patterns like head and shoulders or pennants during active sessions. Having a neatly organised PDF on your mobile device or tablet lets you pull up examples and definitions instantly without wasting time digging through websites or books. This is handy when you’re reviewing charts during a morning coffee or even while travelling.
Structured learning and review
PDF guides usually follow a logical progression, starting with simple patterns and moving to more complex ones. This structured approach helps traders build understanding step-by-step and revisit specific patterns as they practise identifying them on live charts. Plus, many PDFs offer bonus pages for notes or examples, making them useful for compiling personalised insights over time.
Trusted websites and platforms
It’s crucial to source your chart pattern PDFs from reputable sites that focus on forex education. Established trading academies, forex brokers with education sections like IG or Forex.com, and recognised financial blogs tend to offer well-researched, downloadable content. These platforms also update their resources regularly to keep up with market trends, which you won’t always get from casual online PDFs.
Examples of useful downloadable resources
Look out for PDFs that combine clear explanations, annotated charts, and practice exercises. For example, a downloadable guide from a site like BabyPips will often include pattern definitions alongside real market chart screenshots. Interactive PDFs that allow you to highlight or add notes can be particularly useful. Also, some South African forex educators may provide locally tailored PDFs that consider market hours, regulatory environment, and common trading challenges specific to Mzansi.
Keeping well-organised, accessible PDF resources helps traders sharpen their pattern recognition skills and apply technical analysis with greater confidence and speed, especially in dynamic forex markets.
Applying forex chart patterns effectively requires a practical approach that goes beyond simply spotting shapes on a chart. Successful trading depends on confirming these patterns with other market signals and managing risk carefully. Understanding the subtle cues that back up a pattern and preparing for possible downsides can help you make more reliable trading decisions.
Volume as a validation tool
Volume provides crucial insight into the strength behind price movements. When a pattern such as a head and shoulders or a triangle forms, watching volume helps confirm if the move is genuine. For example, a breakout from a triangle pattern accompanied by a spike in trading volume usually indicates strong buyer or seller interest, making the breakout more trustworthy. Without volume confirmation, price moves risk being false signals that might trap traders into bad positions.
In the South African forex market, where liquidity varies, volume can fluctuate significantly — so it’s wise to compare volume levels on platforms like the JSE or through your broker’s tools before acting. Normal volume levels could simply mean indecision, while rising volume adds conviction.
Complementary indicators to strengthen signals
Pairing chart patterns with technical indicators improves confidence in your trade setup. Indicators such as the Relative Strength Index (RSI) or Moving Average Convergence Divergence (MACD) can highlight overbought or oversold conditions and reveal momentum shifts that patterns alone might not fully capture.
For instance, if a double bottom pattern suggests a reversal but the RSI still shows oversold conditions, it could support the idea that the price will bounce upwards. On the other hand, a bearish divergence on the MACD might warn against rushing in. Using these alongside volume readings paints a fuller picture, reducing reliance on patterns alone and smoothing out false signals.
Setting stop-loss points
Every trade based on chart patterns must include a stop-loss to protect your capital from unexpected moves. A good stop-loss is usually placed just beyond the pattern’s invalidation point — for example, below the right shoulder in a head and shoulders pattern or under the latest swing low in a bull flag.
Setting stops too tight risks being taken out by normal market noise, but too loose ones expose you to heavy losses. The key is to balance risk tolerance with the specific behaviour of the currency pair you’re trading. In volatile pairs like USD/ZAR, wider stops might be necessary to avoid being stopped out prematurely during bursts of activity.
Determining position sizes realistically
Knowing how much to risk on a single pattern trade is essential. This depends on your overall trading capital and the distance from entry to stop-loss. For example, if your stop-loss is 50 pips away and you only want to risk R200 per trade, you need to adjust your position size accordingly — buy fewer units so that a 50-pip loss equals R200.
Realistic position sizing keeps losses manageable and guards against overexposure. This is especially important in the forex market where leverage can amplify both gains and losses quickly. Proper money management means you can withstand inevitable losing trades and stay in the game long term.
Understanding and applying these best practices — validating patterns, using additional signals, and strong risk management — can make all the difference between guessing and trading with a clear edge.
When trading forex, recognising chart patterns accurately is just one piece of the puzzle. Common mistakes can cost you dearly if you fall into traps or misread the signals. It’s important to understand these errors and steer clear to improve your chances of success.
False breakouts and traps are among the biggest pitfalls for traders relying on chart patterns. A false breakout happens when the price seemingly breaks out of a pattern, suggesting a strong move in that direction, only to quickly reverse back into the range. For instance, a trader might see a break above a resistance line and enter a buy trade, just to find the price rapidly falling below the support again. This can happen during low liquidity periods or when big players push the market to trigger stops before reversing.
Recognising these traps requires patience and validation. For example, waiting for a candle close beyond the breakout level or confirming with volume spikes can reduce the risk of chasing a false move. Without this caution, you’ll often get caught on the wrong side of the market.
Overconfidence without confirmation is another common mistake. Traders sometimes spot a textbook pattern, like a double bottom or a symmetrical triangle, and jump in without verifying other signals or market context. Overconfidence can lead to entering trades based on patterns alone, ignoring volume, momentum indicators, or overall market sentiment.
Experience shows that combining pattern recognition with tools like the Relative Strength Index (RSI) or Moving Average Convergence Divergence (MACD) improves decision-making. An unconfirmed pattern can lead to losses or whipsaw trades, so resisting the urge to trade purely on pattern visuals is key to managing risk.
Economic events impact is often overlooked by traders focusing solely on chart patterns. Major announcements—like South Africa’s interest rate decisions by the SARB, employment data, or geopolitical news—can overwhelm technical setups. Even the best-formed chart pattern can collapse under the weight of a sudden spike in volatility from unexpected news.
Ignoring these events can lead to nasty surprises, especially if trading on shorter timeframes. For example, a pattern might signal a breakout, but a SARB policy announcement could spark sharp reversals. Staying aware of economic calendars and upcoming data releases helps prevent getting caught in erratic price swings.
Timeframe alignment is another factor that demands attention. Chart patterns appearing on a 15-minute chart may contradict signals on a daily or weekly timeframe. Traders who ignore this often find their trades fail because the broader trend does not support their setup.
Aligning your trading timeframe with the dominant trend seen on higher charts strengthens your probability of success. For instance, a bullish pattern within a long-term downtrend is riskier to trade without confirmation. By comparing multiple timeframes, you can avoid entering trades that swim against the current.
Avoiding these common mistakes improves your confidence and effectiveness in reading forex chart patterns. Always confirm signals, consider the economic backdrop, and match your timeframe to the bigger picture for better results.
Watch for false breakouts and use volume or candle closes as confirmation.
Don’t trade patterns blindly—use supportive indicators to back up your entry.
Keep an eye on economic events, especially SARB announcements, to avoid surprises.
Align chart patterns across different timeframes to ensure you’re trading with the trend.
By steering clear of these frequent errors, you set yourself up for more consistent trading outcomes and make better use of chart patterns in your forex strategy.
📈 Learn to spot key chart patterns in trading with this practical guide. Understand price moves, interpret formations, and access helpful PDF resources to improve your skills.

📊 Learn how to spot reversal chart patterns for smarter trading decisions. Includes clear examples, expert tips, and handy PDF guides to master trends.

🔍 Explore key price action patterns that help you read market moves more clearly and trade smarter without depending on complex indicators. 📈 Ready to improve your charts skills?

Curious about FX trading? 🌍 Learn how currency markets work, key strategies, risks, and how South Africans can confidently trade forex while protecting their investments.
Based on 12 reviews