

Understanding Derivatives in Finance and Maths
📈 Understand derivatives clearly: their types, uses in SA finance, risks, and local rules. A practical guide for investors navigating complex markets.
Edited By
Grace Mitchell
Derivatives form a cornerstone of mathematics, especially when analysing how things change over time or in relation to one another. For traders, investors, financial analysts, brokers, and economists, understanding derivatives goes beyond theory — it helps explain fluctuating prices, risk, and optimisation in real-world markets.
At its core, a derivative measures the rate at which a function changes at any given point. Imagine tracking the speed of a bakkie driving along a highway; the derivative tells you the exact speed at any instant, not just the average over a stretch. This instantaneous rate of change is essential in financial markets where timing and precision can significantly affect outcomes.
Some practical examples include:
Price sensitivity: How the price of a stock changes relative to time or market conditions.
Risk management: Derivatives in finance (like options) help hedge against unpredictable moves.
Economic indicators: Changes in GDP, employment rates, or inflation can be understood better with derivatives.
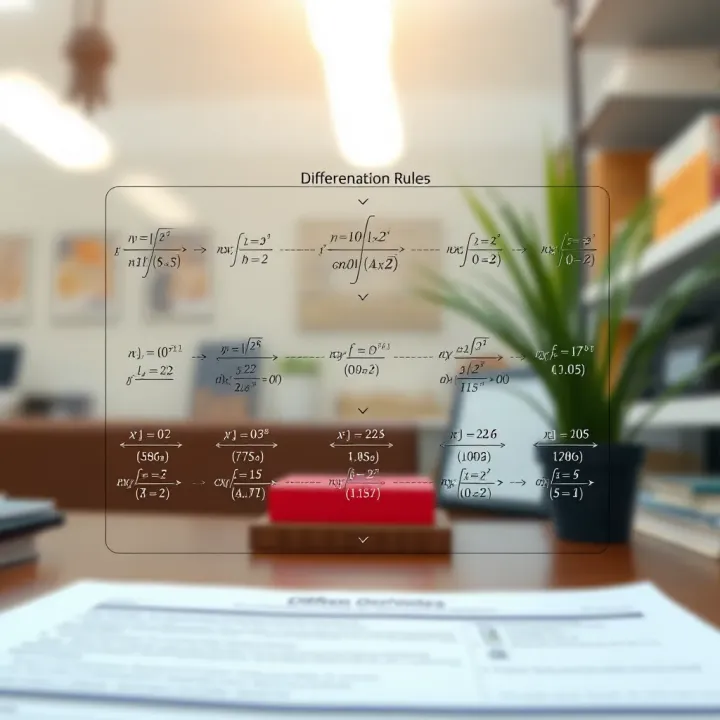
The mathematical process to find a derivative is called differentiation. It relies on several rules:
Power rule: Differentiating expressions like x³ or x⁷ is straightforward, involving multiplying by the exponent and reducing the power by one.
Product and quotient rules: For functions multiplied or divided, these rules handle the complexity.
Chain rule: Used when a function is inside another, such as differentiating sin(x²).
The notation for derivatives mostly involves the symbol f'(x) or (\fracdydx), indicating the rate of change of y with respect to x. Though symbols can look tricky at first, they compactly communicate vast amounts of information.
Understanding the language of derivatives helps financial professionals predict trends, assess volatility, and make informed decisions. It bridges pure maths and everyday business practice.
In this article, we’ll cover these basics and unpack how derivatives operate in various practical settings relevant to South African markets and beyond. Whether you’re analysing a JSE share, monitoring exchange rates, or simply brushing up on your maths, grasping derivatives gives you a sharper edge.
Next, we’ll move beyond the basics into the specific rules and functions that make differentiation a powerful tool throughout economics and finance.
Understanding derivatives is foundational for anyone dealing with changes and trends, especially in fields like finance, economics, and data analysis. Derivatives describe how one quantity changes relative to another, making them invaluable for traders, investors, and economists who need to grasp rates of change or predict future movements. For instance, spotting how quickly a share price fluctuates or how interest rates evolve comes down to derivative concepts.
This section sets the groundwork for the entire discussion on derivatives by clarifying what derivatives really are, both intuitively and mathematically. It explains their practical uses and offers historical context that reveals how this powerful tool developed. This background helps readers appreciate why derivatives matter, so they can apply these ideas with confidence.
At its core, a derivative measures how a function changes as its input changes. Imagine driving a car: the speedometer shows how fast your position changes over time — speed is the derivative of distance with respect to time. In mathematical terms, if you have a function showing a value’s progression, the derivative tells you the exact rate of this change at any specific point.
This concept extends beyond physical distance to many contexts. For example, an economist might look at how consumer spending shifts daily with price changes. The derivative helps quantify this relationship, providing a snapshot of responsiveness or sensitivity.
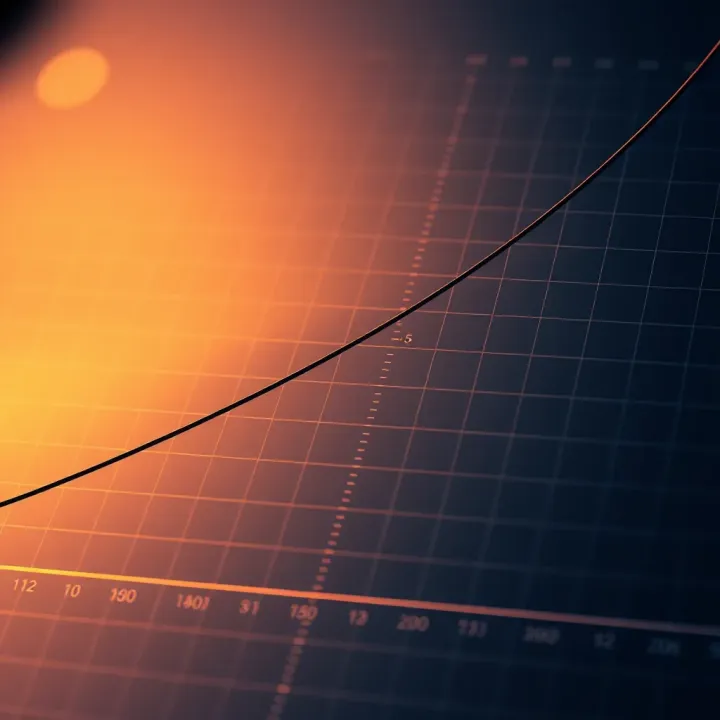
Another way to see derivatives is as the slope of a curve at a particular point. If you plot a graph of share price against time, the derivative at any moment indicates the steepness of the curve — whether prices are rising quickly or slowly.
This slope interpretation is practical because it connects with visual understanding. For traders monitoring volatile markets, knowing the slope helps detect momentum changes. A steep positive slope shows rapid growth, while a flat slope hints at stability, and a negative slope signals decline.
Derivatives give you the "instantaneous speed" of change, crucial for making timely, informed decisions in fast-moving markets.
The idea of derivatives traces back to the 17th century when mathematicians like Sir Isaac Newton and Gottfried Wilhelm Leibniz independently developed calculus. Their work allowed precise descriptions of changing quantities, which was a breakthrough for science and engineering.
Early on, these mathematicians sought to answer problems like finding tangents to curves or calculating rates of change in planetary motions. Their methods laid the foundation for all modern applications of derivatives.
Today, derivatives form the backbone of numerous fields beyond pure mathematics. In finance, for example, derivatives help price options and understand risks. Economists rely on derivatives to model demand elasticity or forecast economic growth.
Advanced computing and software have made calculations easier, but the underlying principles remain the same. For professionals like financial analysts, mastering derivatives clarifies complex relationships and supports smarter strategies.
Overall, knowing the history enhances appreciation and empowers informed use, while understanding the concept and its applications sets the scene for deeper learning about differentiation techniques and real-world use cases.
Understanding the basic rules and techniques of differentiation is vital for anyone working with rates of change, be it in economics, finance, or the physical sciences. These rules provide a toolkit to tackle a broad range of functions systematically and accurately. Without them, finding derivatives would be far more cumbersome, especially when dealing with combinations of functions rather than simple expressions.
Statement and examples: The power rule is one of the simplest and most frequently used differentiation techniques. It states that if you have a function where a variable is raised to a power, say f(x) = x^n, its derivative is f'(x) = n * x^(n-1). For example, if you differentiate x^4, you get 4x^3. This rule is practical for modelling scenarios involving polynomial growth or decay, such as predicting compound interest growth or analysing supply-demand curves.
Applying the rule to polynomials: Polynomials are sums of power functions, like f(x) = 3x^5 - 2x^3 + x - 7. By applying the power rule to each term separately, we differentiate term by term: f'(x) = 15x^4 - 6x^2 + 1. This approach simplifies complex expressions, making it easier to understand the behaviour of financial trends or natural processes represented by polynomials.
How to differentiate products of functions: When two functions are multiplied, their derivative isn't just the product of their individual derivatives. The product rule states that for f(x) = u(x) * v(x), the derivative is f'(x) = u'(x) * v(x) + u(x) * v'(x). For instance, for f(x) = x^2 * sin(x), you differentiate to get 2x * sin(x) + x^2 * cos(x). This rule is especially useful in financial modelling, like calculating the derivative of revenue functions where price and quantity are both variable.
Handling division in differentiation: If you have one function divided by another, the quotient rule comes into play. For f(x) = u(x) / v(x), the derivative is f'(x) = [u'(x) * v(x) - u(x) * v'(x)] / [v(x)]^2. As an example, differentiating (x^3) / (x + 1) requires careful application to avoid mistakes. The quotient rule helps analyse ratios such as productivity rates or cost per unit in economics.
Differentiating composite functions: The chain rule is essential when dealing with functions within functions, such as f(x) = (3x + 2)^5. It tells us to differentiate the outer function and multiply by the derivative of the inner function. So, f'(x) = 5(3x + 2)^4 * 3. In practice, this lets you handle more complicated dependencies, for example, predicting how a change in interest rates affects loan repayments when the relationship isn’t straightforward.
Examples with multiple layers: Sometimes, functions have multiple layers of nesting, like f(x) = sin((x^2 + 1)^3). Applying the chain rule repeatedly, you start from the outer function, differentiate, then move inward layer by layer. This technique is useful in fields where variables depend on other variables in a stepwise fashion, such as in econometric models or assessing compound risk exposures.
Mastering these differentiation rules equips you to handle a wide array of mathematical problems faced daily in trading, finance, and economics. They form the foundation of more advanced calculus concepts, making them indispensable tools in your analytical kit.
Understanding the derivatives of common functions is essential for financial analysts, traders, and economists alike. These derivatives provide the tools needed to model change effectively, whether analysing stock price movements, marginal costs, or interest rates. This section breaks down how to approach derivatives of polynomials, rational, trigonometric, exponential, and logarithmic functions — all critical in mathematical modelling and decision-making.
Easy polynomials are the starting point for many when learning differentiation. A polynomial, such as f(x) = 3x³ - 5x + 2, differentiates straightforwardly by decreasing the power by one and multiplying by the original power — the so-called power rule. For f(x), the derivative f'(x) becomes 9x² - 5. In practical terms, this method allows you to quickly assess how variables like revenue or demand change when modelled using polynomial expressions.
Moving to the approach to rational functions, which are ratios of polynomials like f(x) = (x² + 1)/(x - 3), the process involves using the quotient rule. This rule handles the division in derivatives and comes in handy in economics for calculating rates involving unit costs or average rates of return. The quotient rule ensures accuracy where direct application of the power rule doesn't suffice, allowing you to model more complex financial relationships with precision.
Differentiation of sine, cosine, and tangent functions may seem more specialised but is crucial in fields like physics and certain economic models involving cyclical patterns. The derivative of sin(x) is cos(x), cos(x) differentiates to -sin(x), and tan(x) to sec²(x). These rules are applied often when working with oscillations or periodic trends — for example, modelling seasonal impacts on sales or commodity prices.
Incorporating practical examples helps to solidify these concepts. Consider a trader analysing the cyclical fluctuations of a stock influenced by seasonal factors. Using the derivative of sine or cosine waves, they can quantify the rate of change at different points in a cycle, helping to time buys and sells more effectively. These functions also aid in smoothing and forecasting trends over calendar periods.
Rules for exponential derivatives are fundamental when dealing with growth and decay scenarios common in finance, such as compound interest or depreciation. The derivative of the natural exponential function eˣ remains eˣ, which simplifies calculations for continuous growth models. Applying this to R models or stock price projections allows you to predict future values using well-understood mathematical behaviour.
Logarithmic differentiation techniques come into play particularly when the function is a product or quotient raised to a power, or where the variable appears both in the base and exponent. Taking logs can simplify differentiation tasks significantly. This technique is practical when analysing elasticity in economics or when dissecting complex risk models. For instance, understanding how a portfolio’s volatility scales with different parameters can be made manageable by transforming the function logarithmically before differentiation.
Mastering these common function derivatives equips you with versatile tools to analyse changes in diverse financial contexts efficiently and confidently.
By getting to grips with these foundational derivatives, you build a solid basis for tackling more complicated models and real-world applications linked to market behaviour and economic analysis.
Derivatives are more than just a mathematical concept; they reveal how things change, making them highly valuable in real-world situations. Understanding derivatives graphically and applying them in various fields allow traders, investors, financial analysts, economists, and brokers to make informed decisions based on change rates, trends, and turning points.
The derivative at a specific point on a curve represents the slope of the tangent line at that exact spot. In simple terms, it shows how steep the curve is and whether the function is increasing or decreasing. For example, in a stock price graph, the slope indicates whether the price is rising or falling at that moment, helping investors decide when to buy or sell.
This slope provides immediate information about the behaviour of the function locally. A positive slope means the value is increasing, while a negative slope signals a decline. Zero slope could suggest a possible peak or trough, prompting closer attention.
The tangent line touches the curve at one point, matching both the direction and the steepness of the curve there. This line acts like a local linear approximation, simplifying complex curves into straight lines for easier analysis.
Considering a trader watching fluctuating price movements, the tangent line estimates short-term trends. Understanding this helps predict where prices might head in the near future without crunching complicated formulas every time. It's a vital tools for quick assessments and real-time decisions.
In physics, the derivative of displacement with respect to time gives velocity—a measure of how fast an object moves. Differentiating velocity again results in acceleration, showing how velocity changes over time. For instance, when monitoring a car's journey, these derivatives help understand speed changes and forces involved, useful in automotive engineering and safety testing.
Such concepts underline many financial parallels where rates of change influence strategy, such as how quickly a market responds to news or how acceleration in sales affects supply chain planning.
Economists use derivatives to find marginal values—marginal cost and marginal revenue being prime examples. Marginal cost shows the cost to produce one more unit, while marginal revenue indicates extra income from selling one more unit. These values help businesses decide production levels to maximise profits.
For example, a manufacturer in Gauteng might calculate marginal cost to determine if producing an additional batch of products remains financially viable under fluctuating electricity prices due to loadshedding.
Derivatives identify where a function reaches its highest or lowest points—maxima and minima—critical for optimisation problems. These points occur where the derivative equals zero, indicating potential peaks or troughs.
In investment terms, finding maxima might translate to spotting the best price point to sell an asset, while minima could highlight a good buying opportunity. Analysts use these points to guide trading strategies and risk management.
Derivatives facilitate sketching graphs by revealing where the function increases or decreases and where it bends (concavity). The first derivative identifies rising or falling segments, while the second derivative shows concavity and inflection points.
For instance, an economist modelling inflation trends can sketch a curve showing when inflation accelerates or slows down, helping policymakers adjust interest rates appropriately.
Understanding derivatives goes beyond numbers; it equips professionals with tools to predict, optimise and adapt in fast-changing environments.
By interpreting derivatives graphically, applying them across physics and economics, and solving practical problems, you gain a toolkit for analysing change effectively—essential for making sound, timely decisions in South Africa's dynamic market landscape.
Understanding advanced aspects of derivatives deepens your grasp beyond first-order changes, which is valuable for financial modelling and economic forecasting. These considerations include higher-order derivatives, implicit differentiation, and related rates — each offering tools to analyse more complex relationships where variables are interlinked or changing dynamically.
The second derivative measures how the rate of change itself changes. Practically, this tells you whether a function is curving upwards or downwards — known as concavity. For investors, recognising concavity in a price trend can indicate acceleration or deceleration of returns, useful for timing buys or sells. For example, if a stock’s price acceleration is positive (second derivative above zero), it often suggests upward momentum strengthening.
While less common, third and higher derivatives provide deeper insights like the rate of change of acceleration—sometimes called jerk in physics. In markets, this can relate to sudden shifts or volatility changes. Traders monitoring rapid movements may apply such concepts to identify turning points before traditional indicators catch on. However, these require careful handling and often complex models, making them more suited to quantitative analysts.
Not all relationships show one variable directly in terms of another. In implicit differentiation, you differentiate both sides of an equation involving x and y, then solve for dy/dx. This is crucial when variables entwine, e.g. circular or elliptical relationships, common in optimisation problems. For economists modelling supply and demand curves that aren’t easily isolated, this technique helps find how one affects the other.
Related rates tackle how two or more linked quantities change with time. For instance, if the radius of a circular vat increases steadily, related rates help find how fast the surface area or volume changes. In financial contexts, this can apply to how interest rates and loan amounts evolve over time. Working out these relationships helps analysts anticipate effects of rate changes on investment portfolios or debt servicing.
Mastering these advanced methods boosts your analytical toolkit, allowing sharper insights into dynamic systems where variables interact in complex ways. This can sharpen predictions and improve decision-making in fast-moving financial environments.
Overall, advanced derivative concepts reinforce foundational knowledge, equipping you to handle real-world problems that don’t fit neat, simple models.
📈 Understand derivatives clearly: their types, uses in SA finance, risks, and local rules. A practical guide for investors navigating complex markets.

Explore derif’s meaning, history and use from a South African angle 🧠. Understand its role in theory and daily life across various fields. Learn practical impact here.

Explore how binary implementation powers everyday tech, from logic gates to hardware, shaping devices used across South Africa 💻📱🔧

📈 Learn to spot key chart patterns in trading with this practical guide. Understand price moves, interpret formations, and access helpful PDF resources to improve your skills.
Based on 15 reviews